Mish's Global Economic Trend Analysis |
- Atlanta Fed Halves GDP Forecast to 0.6%; Blue Chip Consensus Eight Miles High
- Major Currencies vs. US Dollar: 2015 Performance
- PE Expansion US, Eurozone, Japan; S&P Number of Days Without 10% Correction; Central Bank Bubble Blowers
| Atlanta Fed Halves GDP Forecast to 0.6%; Blue Chip Consensus Eight Miles High Posted: 13 Mar 2015 11:52 AM PDT It's amusing watching all the GDP forecast downgrades in the wake of a huge string of bad economic data reports, one after another. Following the retail sales report on March 12, the Atlanta Fed GDPNow forceast fell from 1.2 percent to 0.6 percent. "The GDPNow model forecast for real GDP growth (seasonally adjusted annual rate) in the first quarter of 2015 was 0.6 percent on March 12, down from 1.2 percent on March 6." The Fed forgot to update their picture. It still looks like this.  Blue Chip Consensus Eight Miles High I am wondering what the "Blue Chip" forecasters are smoking. By any chance are they getting high off the glue in the string of recent jobs report? To be fair, the "Blue Chip" forecast is as February 24, but by then the Fed Model had already been heading south. Regardless, we are now at 0.6 percent and falling fast in the Fed model. The latest "Blue Chip" forecast is seemingly Eight Miles High. This calls for a musical tribute. Link if video does not play: Byrds - Eight Miles High. Of course, there is one rational explanation for these estimates to be so wildly different: Weather Unexpectedly Much Worse Than Economists Previously Thought. Mike "Mish" Shedlock http://globaleconomicanalysis.blogspot.com |
| Major Currencies vs. US Dollar: 2015 Performance Posted: 13 Mar 2015 10:22 AM PDT One self-explanatory chart from Bloomberg conveys the overwhelming strength of the the US dollar this year. Major Currencies vs. US Dollar Year to Date 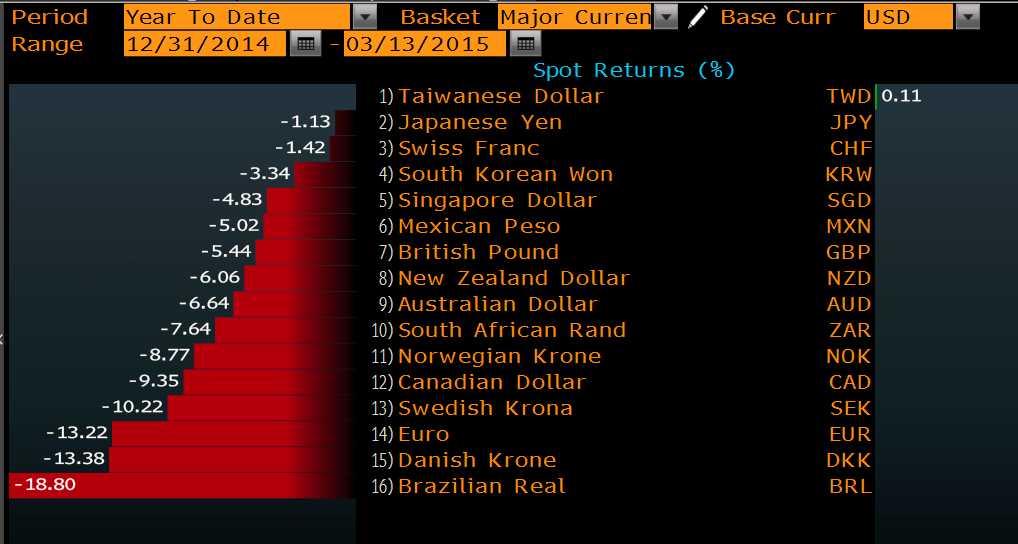 If you wish to include some currencies you likely have never heard of, the winner is the Malawian Kwacha, up 6.42 percent against the US dollar this year. The Somali Shilling, up 2.74%; the Seychelles Rupee, up 2.17%; the Suriname Dollar, up 1.87%, and the Costa Rican Colon, up 1.11% round out the top five. Best Performers vs. US Dollar  click on any chart for sharper image Mike "Mish" Shedlock http://globaleconomicanalysis.blogspot.com |
| Posted: 13 Mar 2015 12:06 AM PDT Albert Edwards at Society General emailed a PDF on PE expansion and other equity trends. Albert comments ... "Mario Draghi and the ECB's manipulation of asset prices make s Greenspan's Fed look like a rank amateur. More shocking though than the plunge in the euro, and more shocking even that 25% of sovereign eurozone bonds now trade in negative territory, is what has happened to eurozone equity valuations. For, as we approach the sixth anniversary of the US cyclical bull market (a post-war record), the PE expansion of eurozone equities is simply off the scale. History suggests this will end very badly indeed. Ask Alan!" Eurozone 6-Year PE Expanded 220%  click on any chart for sharper image Longest Post-War Bull Market in Months - S&P 500  Trading Days Without 10% Correction - S&P 500  12-Month Forward PEs Japan, US, Eurozone  Note the PE expansion in the US and Eurozone and the lack of it in Japan Mike "Mish" Shedlock http://globaleconomicanalysis.blogspot.com |
| You are subscribed to email updates from Mish's Global Economic Trend Analysis To stop receiving these emails, you may unsubscribe now. | Email delivery powered by Google |
| Google Inc., 1600 Amphitheatre Parkway, Mountain View, CA 94043, United States | |
No comments:
Post a Comment