Mish's Global Economic Trend Analysis |
- Wrong Time, Altered Videos, More Lies From Kiev
- Employment Perspective in Pictures: Only 25% of Decline in Fulltime Employment Attributable to Aging Workforce
- Nonfarm Payrolls 209,000, Unemployment 6.2%, Employed +131,000
| Wrong Time, Altered Videos, More Lies From Kiev Posted: 01 Aug 2014 04:53 PM PDT Since the crash of MH17, Ukraine has stated repeatedly it had no weapons capable of downing the aircraft. The claims are blatant lies as noted in the video below by Ukrainian citizen, Anatole Sharyi. I wish I had English subtitles to the video, but a translation from Jacob Dreizin, a US citizen who speaks Russian and reads Ukrainian, will have to suffice. "Chas Ch" - H Hour From Dreizin ... Sharyi has found a clip that was broadcast on the Ukranian TV program "Chas Ch" ("H Hour") showing a Ukrainian Buk launcher (en face and then in profile) and attendant Kupol radar along with--around 52-54 seconds, off to the right--what appears to be some box-type, high-altitude SAM launcher, possibly a "Tor" variant.Claims Then Denial There you have it, Ukraine was bragging about and even showing videos of Buks in the area, then next day denyied them. If someone can put reliable English subtitles on that video, I would appreciate it. Second Video Here's a link to an even a longer 10-minute video, complete with a militarist patriotic intro. From Dreizin ... In this video, the caption at the top (within the video) also reads July 16th. While it's not possible to conclusively verify from the program itself as to the date of the video, the voice-over near the beginning--which mentions place names near the Russian border where battles are occurring, as well as an accusation that artillery over the border in Russia has been bombarding Ukrainian forces--makes clear that it was broadcast this month, and probably mid-month. Thus, I have no reason to believe that this was not broadcast on July 16th.The US would rather believe a Facebook page that says what the US wants to hear, rather than a direct claim and videos of Ukrainian Buks in rebel territory published the day before the attack. Buk System By the way, please take another look at that first video, even if you cannot understand it. All media reports focus on the missile launcher. However, a Buk system takes at least three tank-sized components to operate. Buk System Components
The first three units all have to be present in the area, functional, and must be in communication-radio line-of-sight. The logistics vehicle carries supplies and reload missiles. Wikipedia explains "In general, the system identifies potential targets (radar), selects a particular target (command), fires a missile (launcher) at the target, and resupplies the system (logistics). The missiles require a radar lock to initially steer the missile to the target until the missile's on-board radar system takes over to provide final course corrections. A proximity fuse aboard the missile determines when it will detonate, creating an expanding fragmentation pattern of missile components and warhead to intercept and destroy the target." Thus, a launcher by itself rolling around the countryside does not do much on its own accord. The "Chas Ch" video (first one) shows that well enough. Wrong Time, Altered Images It should not take two weeks to produce satellite images. But it did. And they were very sloppy. Please consider 'Wrong Time, Altered Images': Moscow Slams Kiev's MH17 Satellite Data. Satellite images Kiev published as 'proof' it didn't deploy anti-aircraft batteries around the MH17 crash site carry altered time-stamps and are from days after the MH17 tragedy, the Russian Defense Ministry has revealed.Moscow Statement Rather than rely on RT, inquiring minds may wish to see Images and Analysis of Satellite Imagery Released by Ukraine, official analysis as released by Russian Ministry of Defense. Russia claims that Ukraine did not have satellites over that area at the time. The US did. And the images appear to be sloppily doctored, if you believe Russian analysis. Perhaps you don't want to, but I suggest Russian analysis appears far more professional, and timely than anything Ukraine or the US puts out. Regardless, it's clear both sides have engaged in tremendous amount of propaganda. Even if you do not believe Russia, there is absolutely no reason to believe a parade of lies from Kiev, 100% in plain sight. Mike "Mish" Shedlock http://globaleconomicanalysis.blogspot.com |
| Posted: 01 Aug 2014 12:04 PM PDT Here's a series of charts from reader Tim Wallace on various aspects of employment, labor force, and population. The charts use seasonally unadjusted data, July of 2014 compared to July in prior years. click on any chart for sharper image Age 16 and Over  Age 16 and Over Full-Time Employment Percentage  Age 25-54  Age 25-54 Full-Time Employment Percentage  Age 55 and Over  Age 55 and Over Full-Time Employment Percentage  Mish Notes Because of the aging workforce, the first chart in each series has a slight negative bias. For example: Note a relatively small decline in population in age group 25-54 from 125,715,000 to 124,500,000. That decline accounts for 1,215,000 of the drop in full-time employment from 99,912,000 to 95,098,000 (a drop of 4,814,000). The normalized drop in full-time employment is thus 4,814,000 - 1,215,000 or 3,599,000 which is still a pretty damning statistic. Here's another way of looking at things: Only 25% of the decline in full-time employment in the 25-54 age group can be attributed to the aging work force. The rest is overall economic weakness. The second, fourth, and sixth charts showing percentage changes provide an overall accurate view. Mike "Mish" Shedlock http://globaleconomicanalysis.blogspot.com |
| Nonfarm Payrolls 209,000, Unemployment 6.2%, Employed +131,000 Posted: 01 Aug 2014 08:11 AM PDT Initial Reaction Counting the upwardly revised 298,000 nonfarm payroll report in June (originally reported as 288,000), this was a decent report. Yet, digging into the details, the household survey showed a gain in employment of only 131,000. Thus, for the second consecutive month, the household survey was substantially weaker than the headline number. The unemployment rate rose by 0.1% (by 197,000) thanks to a rise in the labor force greater than the rise in employment. May BLS Jobs Statistics at a Glance
Additional Notes About the Unemployment Rate
Please note that over the course of the last year, the working-age population rose by more than the number of people employed. In normal times, the unemployment rate would have gone up slightly. Instead, the unemployment rate fell from 7.3% to 6.2%. Over 100% of the decline in unemployment was due to people dropping out of the labor force, rather than strength in the economy! July 2014 Employment Report Please consider the Bureau of Labor Statistics (BLS) July 2014 Employment Report. Total nonfarm payroll employment increased by 209,000 in July, and the unemployment rate was little changed at 6.2 percent, the U.S. Bureau of Labor Statistics reported today. Job gains occurred in professional and business services, manufacturing, retail trade, and construction. Click on Any Chart in this Report to See a Sharper Image Unemployment Rate - Seasonally Adjusted  Nonfarm Employment January 2003 - July 2014  click on chart for sharper image Nonfarm Employment Change from Previous Month by Job Type  Hours and Wages Average weekly hours of all private employees has been flat for five months at 34.5 hours. Average weekly hours of all private service-providing employees was flat at 33.3 hours. Average hourly earnings of private workers rose $0.04 to $20.61. Average hourly earnings of private service-providing employees rose $0.03 to $20.39. For discussion of income distribution, please see What's "Really" Behind Gross Inequalities In Income Distribution? Birth Death Model Starting January, I dropped the Birth/Death Model charts from this report. For those who follow the numbers, I keep this caution: Do not subtract the reported Birth-Death number from the reported headline number. That approach is statistically invalid. Should anything interesting arise in the Birth/Death numbers, I will add the charts back. Table 15 BLS Alternate Measures of Unemployment 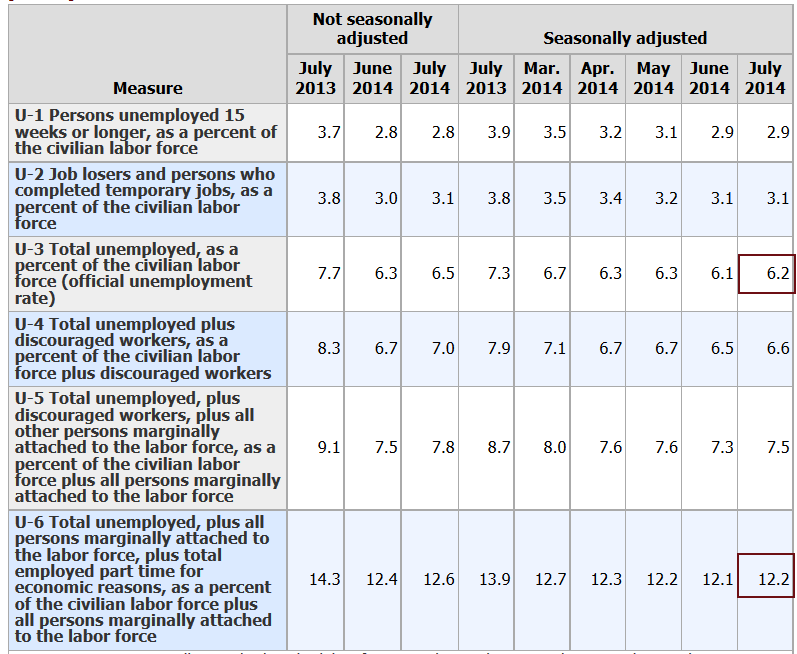 click on chart for sharper image Table A-15 is where one can find a better approximation of what the unemployment rate really is. Notice I said "better" approximation not to be confused with "good" approximation. The official unemployment rate is 6.2%. However, if you start counting all the people who want a job but gave up, all the people with part-time jobs that want a full-time job, all the people who dropped off the unemployment rolls because their unemployment benefits ran out, etc., you get a closer picture of what the unemployment rate is. That number is in the last row labeled U-6. U-6 is much higher at 12.2%. Both numbers would be way higher still, were it not for millions dropping out of the labor force over the past few years. Labor Force Factors
Were it not for people dropping out of the labor force over the past several years, the unemployment rate would be well over 9%. Mike "Mish" Shedlock http://globaleconomicanalysis.blogspot.com |
| You are subscribed to email updates from Mish's Global Economic Trend Analysis To stop receiving these emails, you may unsubscribe now. | Email delivery powered by Google |
| Google Inc., 20 West Kinzie, Chicago IL USA 60610 | |
No comments:
Post a Comment