Mish's Global Economic Trend Analysis |
| Treasury Yields Surge Following Allegedly Good Data; Is Bernanke Getting the Message? Posted: 01 Aug 2013 03:42 PM PDT Curve Watchers Anonymous notes treasury yields are on the rise following allegedly good economic data. For my take on the GDP, please see About that "Beat the Street" GDP Number. Nonetheless, the bond market has other ideas. Historical Yield Curve - Monthly Close  click on chart for sharper image
Market Gets Message On July 17, Bernanke boldly stated Markets finally get message. Federal Reserve Chairman Ben Bernanke on Wednesday admitted there has been some confusion as the central bank has tried to explain plans to scale back its stimulus policies, but said he thought financial markets were "beginning to understand our message."Talk is Cheap Bernanke and numerous other Fed spokesmen attempted to talk yields lower following the huge surge since the beginning of May. Let's tune in and see how well talk worked. $TYX - 30 Year Yield Daily Chart 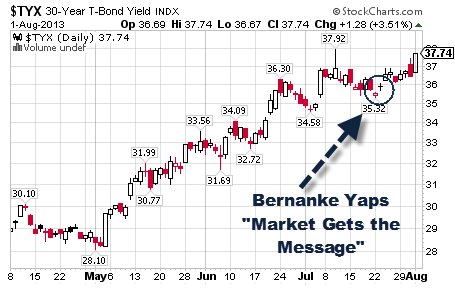 $TNX - 10 Year Yield Daily Chart  It appears the bond market may have had enough of Bernanke's talk. Is Bernanke getting the message? Mike "Mish" Shedlock http://globaleconomicanalysis.blogspot.com |
| India Housing Bubble Still Expanding Posted: 01 Aug 2013 10:08 AM PDT This is a guest post from by Deepak Shenoy, an economic blogger at Capital Mind in India. Charts and analysis that follow are from Deepak. RBI has released the latest data for their House Price Index and it looks like the mad pace of real estate price growth has mellowed, but only slightly. Price growth at an all India basis is now 19% from last year.  Unfortunately, RBI has not released information about transactions, so we don't know if volumes are up or down. Housing prices were very high last quarter as well, with prices up 26% year on year. However, every city is different; some cities seem to have slowed down price growth while others have picked up pace significantly. Mumbai and Delhi Still Red-Hot, But Slower Than Earlier Quarter Mumbai shows YoY growth of just 11% after a scorching 30% growth in the December quarter (year on year).  Delhi, though, continues to be in scorched earth territory, moving up 33% from last year. Prices have gone up an annualized 30% or more since September 2011, and the index has now reached 259 from a 100 in March 2009 (a compounded growth of 27%, the highest of all cities). Bangalore and Chennai Show Faster Growth  Bangalore hit 5% price growth in Q4 (March 2013). This is benign, for now. Chennai is now at 26% price growth and again, looks like it has gone out of control. Kolkata and Lucknow: The Hot Air Balloons  Kolkata has gone absolutely nuts with a 63% price growth, taking its own compounded price growth from 2009 to 27%, just behind Delhi. Lucknow, with 29% YoY growth, is still among the fastest growers. Note that the drop in transaction volumes in the previous quarter seems to have had no impact on price growth. Jaipur grows 18%, Ahmedabad remains at 9%  Jaipur prics are up the highest since December 2010 (on a yoy growth basis). Ahmedabad shows signs of softening, though prices have grown slower in the 2010-11 time frame. Kanpur the weakest link  Kanpur shows a drop of over 21% on prices. Last time I was told of some inaccuracies in Kanpur in that much of the price is in "black" (paid in cash) and thus not recorded. Compounded Growth Rate Since 2009 at 21% As of March 2013, Prices have more than doubled since 2009. The All-India Index is at 211, from 100 in March 2009.  The bubble is intact. But is the bubble bursting? QoQ growth is the second lowest since the data has been recorded – an all India QoQ growth level of 2.1% (versus 6.4% last quarter). Credit will be constrained from July onwards, so it is quite likely that price growth is hit. Already, rental prices have flattened or reduced, and commercial rents and prices are down (speaking of the June quarter, from anecdotal information). A credit crunch could well cause developer defaults, and then prices will truly fall. For now, the bubble is well and truly visible. End Deepak Needless to say (but I am going to say it anyway), this India housing bubble is going to end very badly, especially for those who got in recently. Mike "Mish" Shedlock http://globaleconomicanalysis.blogspot.com |
| You are subscribed to email updates from Mish's Global Economic Trend Analysis To stop receiving these emails, you may unsubscribe now. | Email delivery powered by Google |
| Google Inc., 20 West Kinzie, Chicago IL USA 60610 | |
No comments:
Post a Comment